


Algonquin College
How Algonquin empowered their team with web analytics
Our partnership with Algonquin College shows how just one strategic project can elevate the way hundreds of people in an organization work. By creating 200+ custom analytics dashboards, we enhanced the ability of Algonquin's staff members to interact with and derive valuable insights from their web data.
Meet Algonquin College
Algonquin College of Applied Arts and Technology is a leading educational institution in Ottawa. To keep up with the rapidly evolving digital landscape, Algonquin College sought to upgrade their web analytics from Google Analytics version 3 to the more advanced Google Analytics 4. But more importantly, they needed their 100+ campus teams to be able to access and interpret their data.
Understanding the challenge
Every campus team at Algonquin College has a unique focus, all teams were organized in GA3 with "views", which no longer exist in GA4. The challenge was not just migrating their data, but ensuring every team could easily access and understand their data without getting overwhelmed by the new system.
Phase 1: Strategy outline
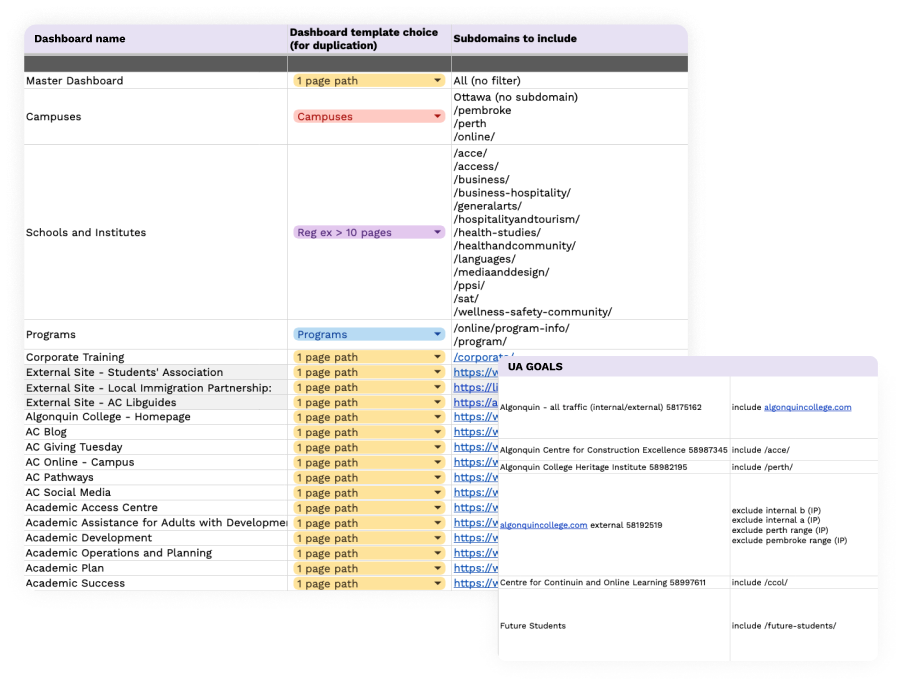
We created a detailed spreadsheet with multiple tabs, focusing primarily on outlining the various teams and the specific website pages they wanted to analyze during the strategy phase. This helped us determine the number of dashboards needed.
Additionally, we defined the goals and conversions relevant to each team and had our point of contact discuss with them if they needed any updates.
Phase 2: Data collection setup
Once we established our strategy for tracking and presentation, we set up a comprehensive data collection framework. This included properly installing tracking codes and integrating Google Analytics, Google Search Console, and Google Tag Manager (GTM). The primary goal was to set up tags to monitor key actions on the site.
We enabled two main types of tags in GTM to lay the groundwork for the next phase:
1. Basic Tags: We used GTM to override some automated events in the new GA4, like video tracking and scroll tracking, to leverage additional tracking opportunities.
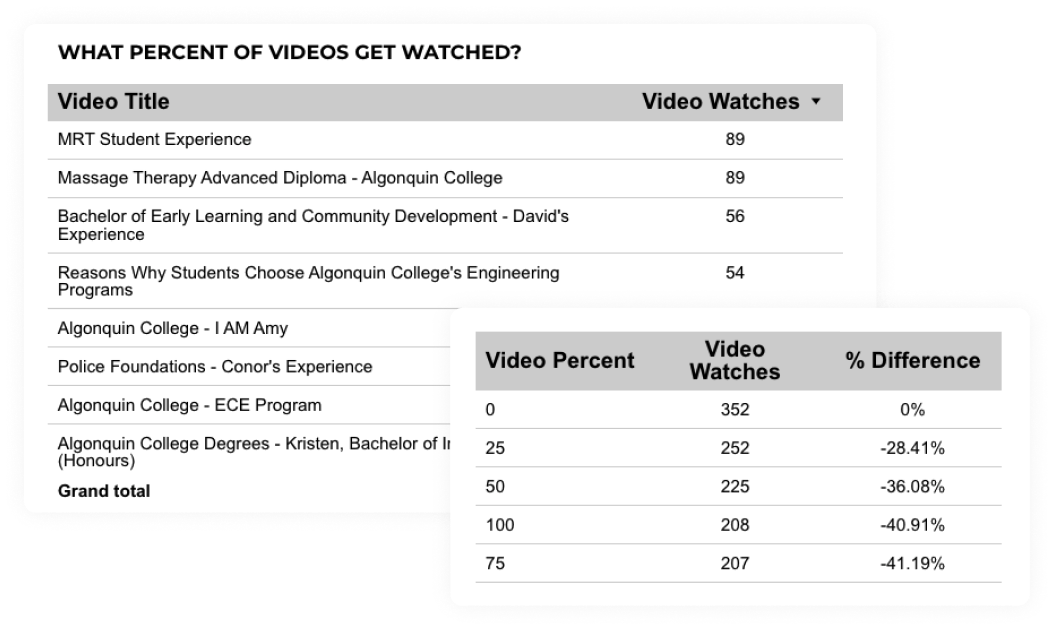
Example: In Google Analytics, video tracking is enabled with enhanced measurements, but it doesn’t provide detailed progress reports for specific videos. By setting up the event in GTM, we added video percent tracking. This allows us to see how many people watched 25%, 50%, or 75% of a video, helping us better understand the drop-off rate.
The dashboard screenshot below shows two tables with cross-filtering enabled, allowing you to click on a video title and view detailed data for that specific video in the table on the right.
2. Custom Tags: Beyond the standard tags like video tracking, we also implemented several custom tags that required coding modifications and HTML or data layer setup in GTM.
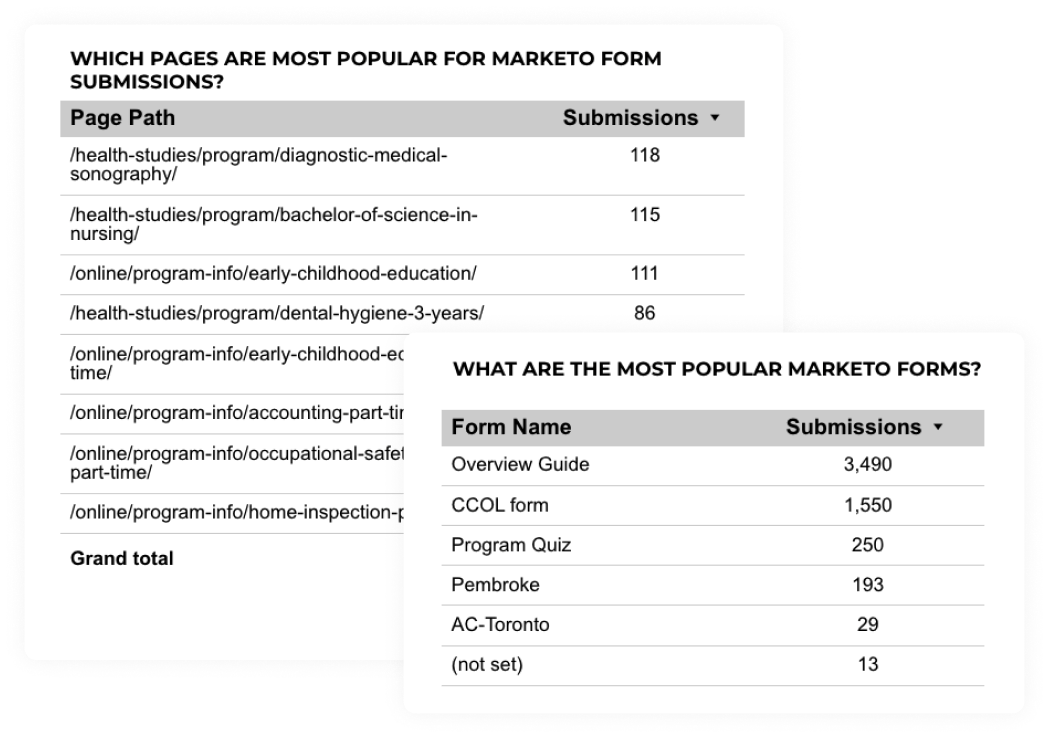
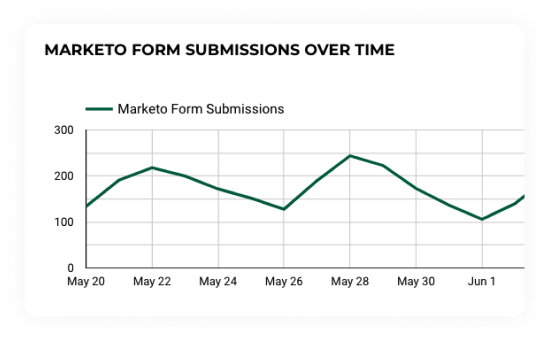
Example: We set up tags to track various forms across the site. These custom tags now allow us to reference forms by name and display the number of submissions. Additionally, we can see which pages the forms are submitted from, providing insight into user behavior on pages where forms appear.
Phase 3: Reporting dashboards
With the data collection framework and tags in place, we shifted our focus to creating customized, user-friendly dashboards.
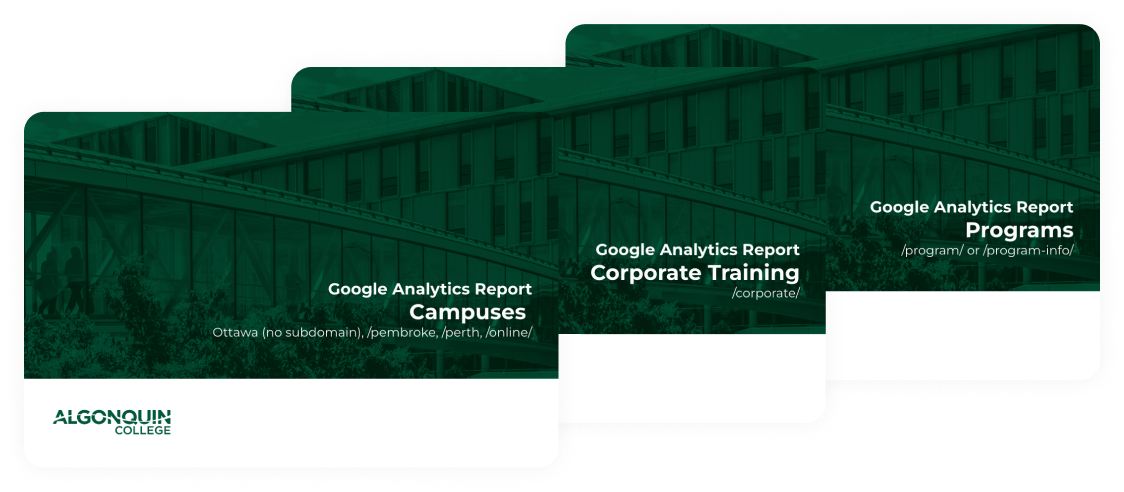
Using Looker Studio, we developed branded and informative dashboards that are easy for teams to use. These dashboards eliminate the need for direct interaction with the new Google Analytics 4 platform, simplifying the process for everyone involved.
Each team has its own dashboard, pre-filtered to show their specific pages, conversions, and actions of interest. Additionally, each page includes explainer text to remind less frequent users of important definitions and how to interpret the data.
Project results

Data can be easily accessed and understood

Minimal training required to use the dashboards


Teams are empowered to make data-driven decisions
Execution and implementation
We used five main tools to get the job done:
Google Sheets 📉: Centralized planning and progress tracking tool.
Google Analytics 📊: Key tool for capturing user interactions on the website.
Google Tag Manager 🏷️: Enhanced tracking of user interactions not automatically captured by Analytics.
Google Search Console 🔍: Insight into the site’s search presence and performance on Google.
Looker Studio 📈: Visualization tool for creating accessible dashboards and reports.
Driving results
The dashboards were designed for easy cross-filtering, allowing teams to drill down into various data combinations. Here are some examples of the pages present in the dashboard.
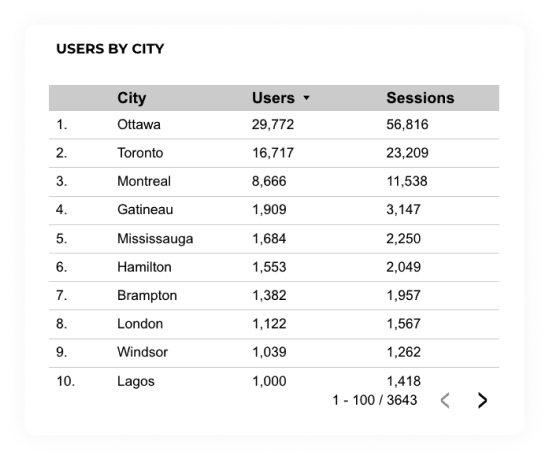
Demographics, Interests, and Geography: Data about users' demographics, geographic distribution, and interests.
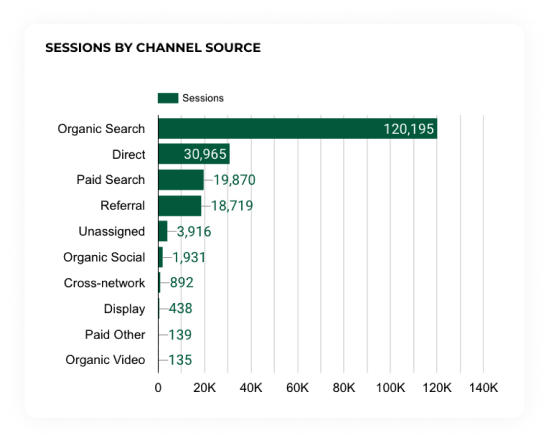
Traffic Sources: Where visitors come from, such as organic search, paid search, direct visits, and social media. For example, they can now see the leading traffic sources for form submissions or video watches, helping them understand which marketing channels are most effective.
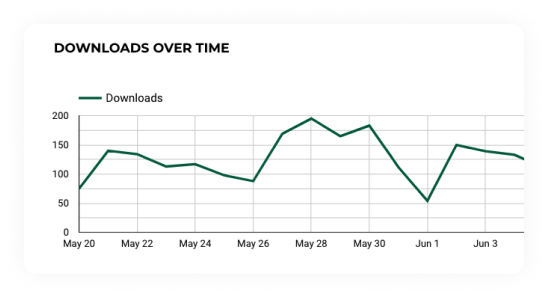
Event Tracking: actions like video plays and clicks on specific elements.
Conversion Tracking: Success rates for goals like form submissions and sign-ups.
User Behaviour and Content Performance: Metrics like page views, session duration, and bounce rate to understand how users interact with the site.
Google review
Looking ahead
By providing a user-friendly interface and tailored data views, these dashboards have become invaluable tools for strategic planning, website optimization, and data-driven decision making for Algonquin College.